One dependency graph
Every signal — from a vendor incident to a scanner anomaly — resolves to the same model of functions, processes, systems, vendors, people. Numbers compare. Decisions compound.
New in vCISO Lite · live now
A vendor gets breached and you already have a defensible exposure number — the same hour the news breaks. The single points of failure that would actually take you down are ranked by what fixing them is worth, not by who yelled the loudest. And the next risk is on the screen while it’s still forming.
Three engines, one layer. We call it Allotrope — one element, three forms.
You can predict the future
Most risk tools tell you what already happened, in colors. Allotrope tells you what’s about to happen, in dollars— so the decision is obvious before the loss, not the post-mortem.
The week, as it actually goes
Three to ten days of CTO and security time per fire. Multiplied across a year of vendor disclosures, dependency wobbles, and audit cycles, you’re paying for the same fire-fighting over and over — while the work itself never compounds. Allotrope ends each fire with the engine built for it, on one layer that gets smarter with every one.
A vendor you depend on gets breached.
≈ 3 days · 6 people · a guess for the CEO
War room. The same question for two days: are we affected? You ship a hedged answer and hope.
01 Refraction
A defensible exposure number in the first hour.
Probability the incident reaches you, what it would cost, the cheapest move that cuts it most. The scramble never starts.
See itA single point of failure quietly trips.
Unknown — visible in spreadsheets nobody opens
The dependency that took you down was knowable weeks ago. The post-mortem writes itself, then sits in a folder.
02 Keystone
The single points of failure, ranked by what fixing them is worth.
Concentration scored against your board-ratified limits, blast radius priced in revenue, mitigations with first-year ROI attached.
See itAudit or board season hits.
≈ 2 weeks of senior time · rebuilt from scratch
Re-pull the same evidence. Re-write the same KRI section. Re-explain why the heat map is still amber. Repeat next quarter.
03 Continuous Indicators
The board report your GRC tool can’t write.
Leading indicators derived live from your environment. Every decision and attestation compounds as evidence for the next audit.
See itEngine 01 · Refraction
Your CTO will love this.
The headline says a vendor you depend on was breached. Today that’s an all-hands scramble — war room, six people, two days, no number to give the CEO. Refraction gives you the number the same hour the news breaks: the probability the incident reaches you, what it would cost if it did, and the cheapest move that cuts it most. The scramble never starts.
Nobody else is doing this. Vendor risk today stops at a contract-time questionnaire and an annual DPO review — defensible on paper, useless when the headline drops. Refractionis the first quantified, conditional answer to the only question that matters when someone else’s breach hits the news.
↓ An exposure number only means something if you know which functions in your business actually depend on that vendor.
Disclosed by GitHub. 14 customer orgs confirmed affected, +3 in the last 48h.
Exposure analysis
Your tokens are org-wide; you’re in the affected population.
No secret rotation in 92 days; 3 repos with long-lived keys.
IP allowlist on, but token scopes broad enough to reach prod CI.
Decision — ranked by risk-adjusted cost
Engine 02 · Keystone
Your auditor will love this.
A handful of vendors quietly carry your whole business. Keystonereads your live dependency graph, finds the single points of failure, and prices each one in revenue at risk — so you spend on the fix that’s actually worth the most, and hand your auditor live proof that you’re running the resilience process, not just describing it.
↓ The risk forming right now isn’t in your vendor list yet — it’s in the live signals coming off your own environment.
Single-vendor concentration · critical functions
3 risks past your board-ratified limit of 2.
Blast radius — if Okta drops
If Okta goes down for 4 hours
Add a backup identity provider$45K cost · 4,900% first-year return
Engine 03 · Continuous Indicators
Your board will love this.
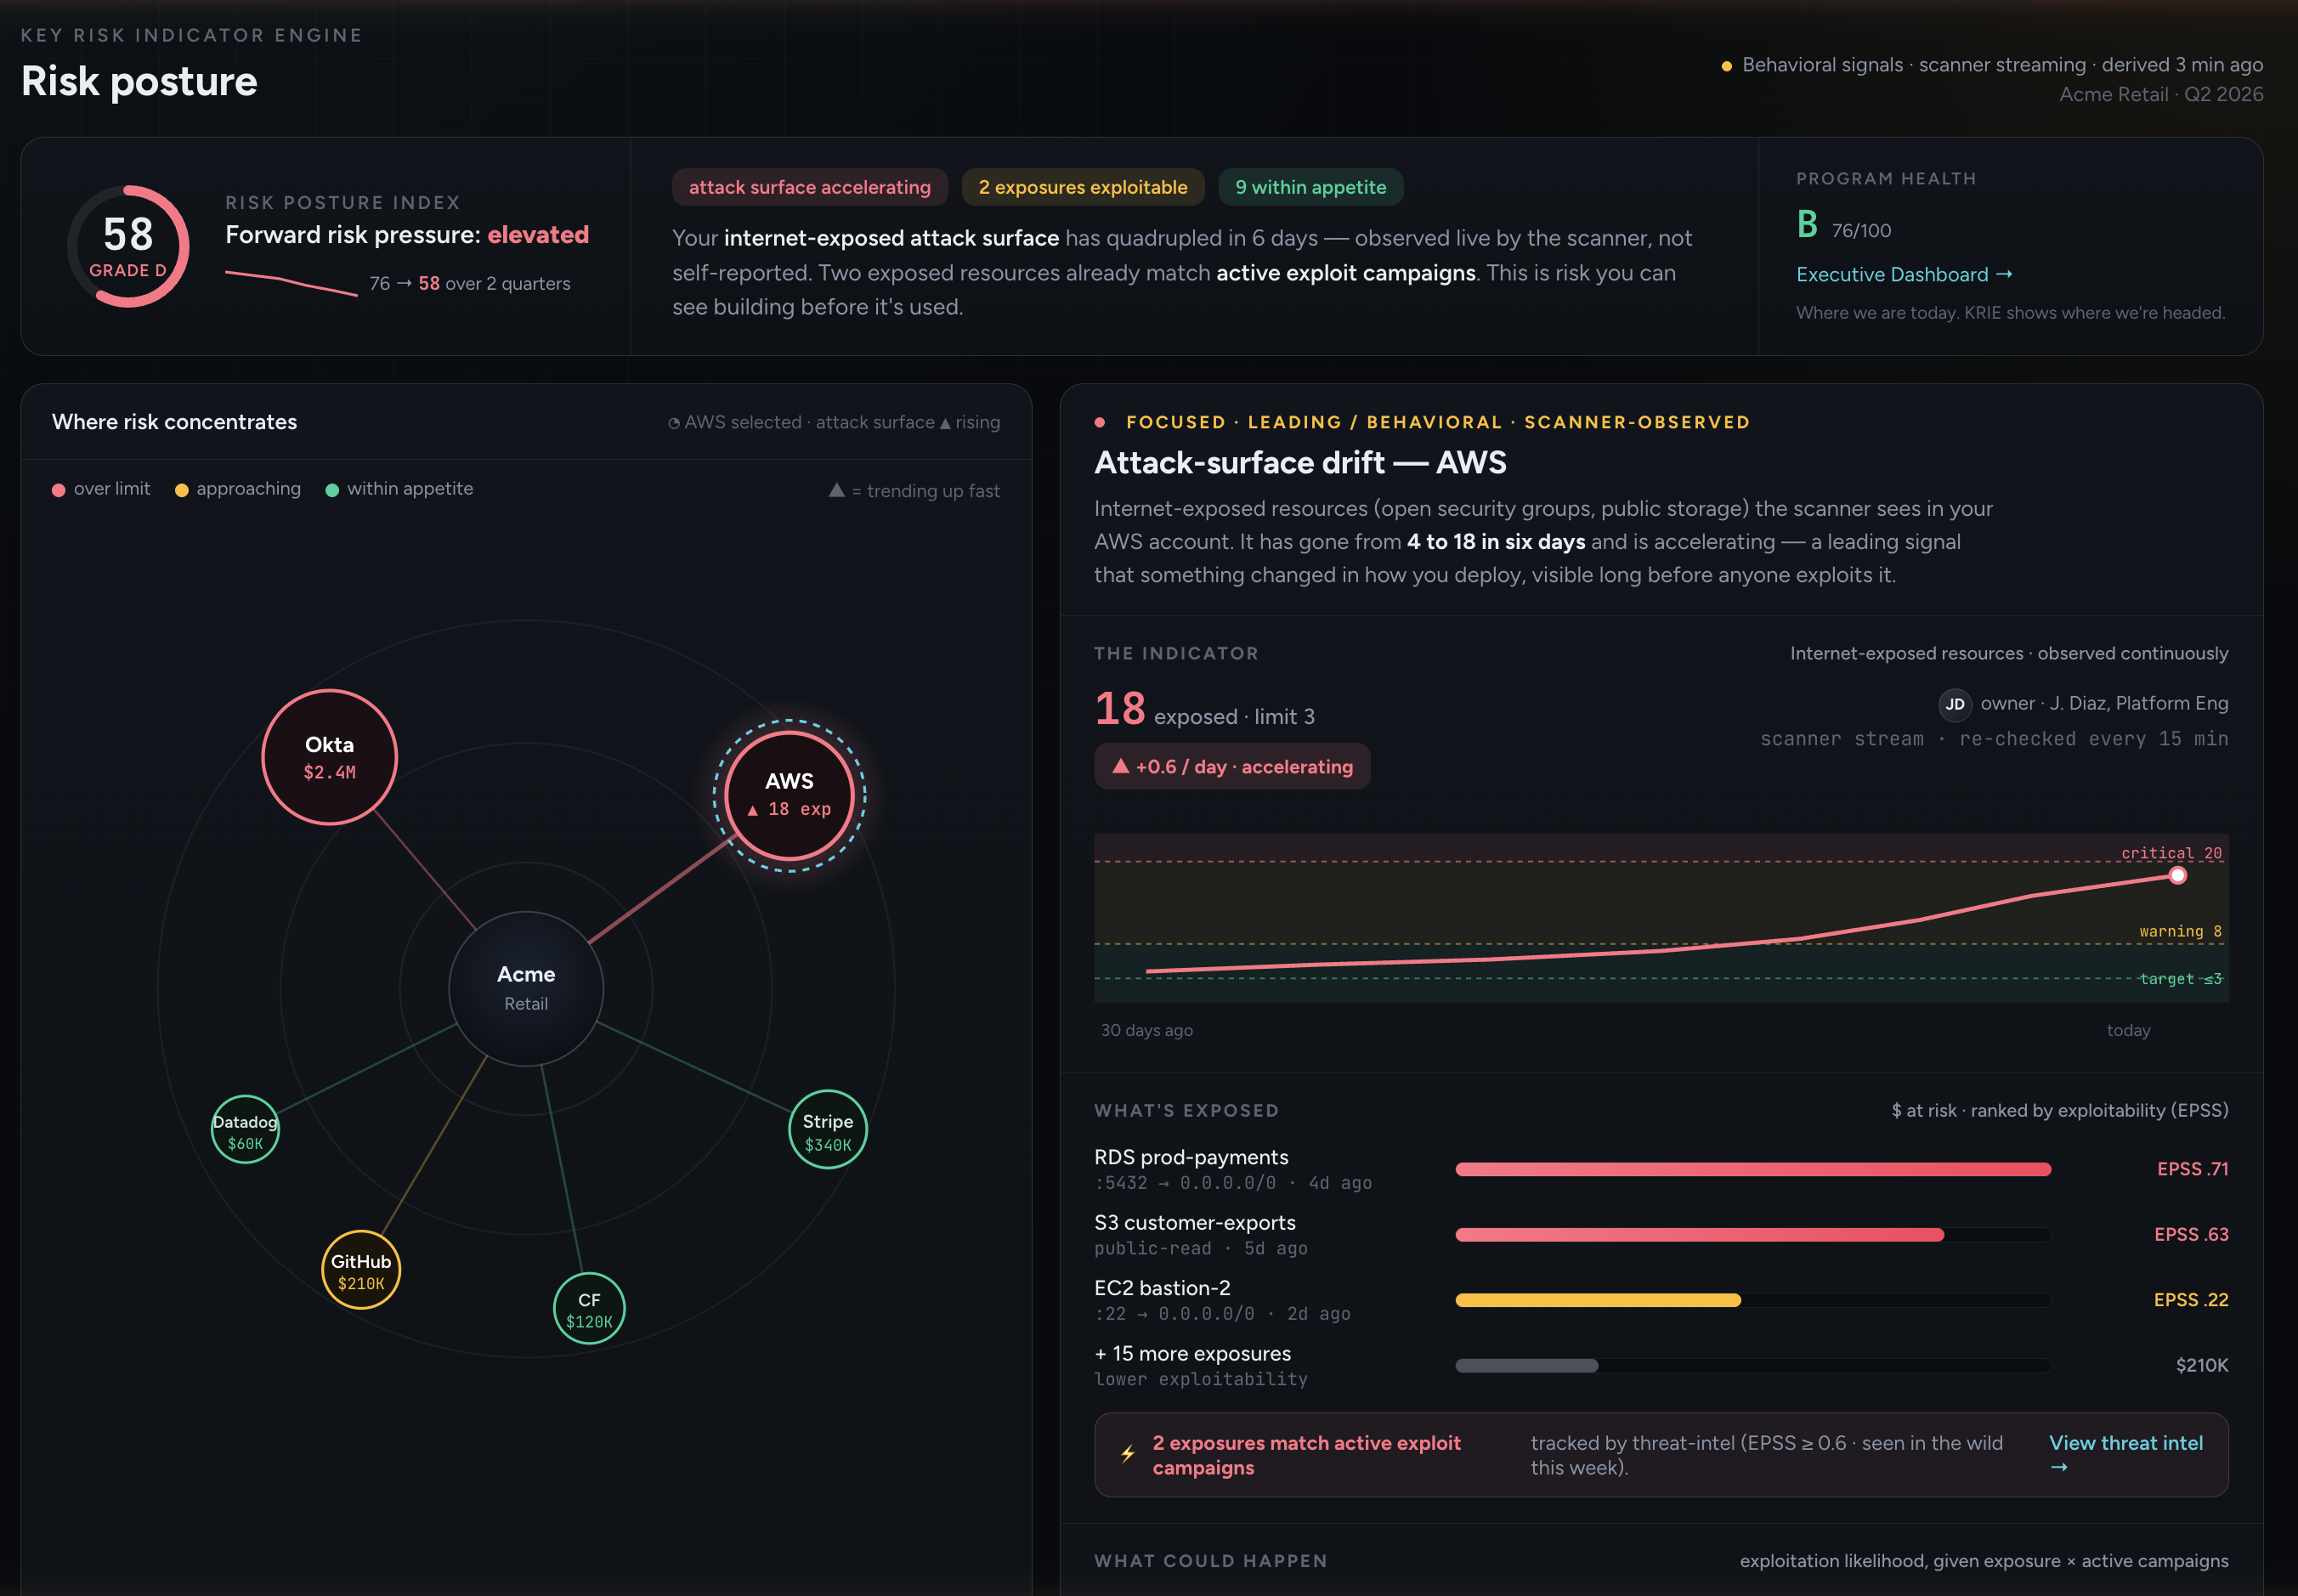
Most “Key Risk Indicators” were typed into a spreadsheet years ago and predict nothing. Continuous Indicatorsderives them live from your own environment — each one leading, priced in dollars, with a named owner and the reasoning shown. It’s the one-page risk briefing a CTO can forward straight to the board.
Three engines, one Risk Posture Index. Forwardable to the board as-is.
Why no one else has done this
Plenty of products do one of these. Nothing else does all four on one layer.
Every signal — from a vendor incident to a scanner anomaly — resolves to the same model of functions, processes, systems, vendors, people. Numbers compare. Decisions compound.
Every output is a probability and a number. Boards understand it. Insurers underwrite against it. Spend defends itself with first-year ROI on every mitigation.
Re-derived hourly during incidents, on graph change for structure, continuously from scanners. The number you see is the number that’s true right now — not from last quarter.
Every decision — every mitigation taken, every threshold breach, every audit attestation — becomes evidence for the next audit, board pack, and incident. The work accumulates instead of starting over.
Learn more
Allotrope is built on three peer-reviewed engines and one pillar article that ties the program-management thread together. The math, the calibration, the worked examples — for the reader who wants the substance, not the pitch.
Academic paper · PDF
A dependency-aware framework for KRI derivation
The full methodology behind Continuous Indicators: algorithms, calibration protocol, worked examples on Acme Retail.
Academic paper · PDF
Dependency-Centric Third-Party Incident Response
The framework behind Refraction — how to compute your conditional exposure to someone else’s breach.
Pillar article
Why your KRIs stopped predicting anything
The four ways every KRI program goes stale — and what a leading indicator looks like instead. The argument for Continuous Indicators.
Series
The Continuous Indicators series
Six articles, biweekly. Forward risk vs. backward risk, the math behind the probabilities, and how thresholds stay honest over time.